Quick Economic Analysis of the Solar/BESS
Published:
By Jeff MacKinnon, P.Eng.
To this point we have determined if the PV/BESS system could technically work to replace a standby genset, and also provide some relief from utility expenses.
The first step we took to determine if this is going to make sense is a very simple payback in today's dollars, and in both cases the payback in years was very very long.
I don't want to stop there though, so I want to try two more things:
- Calculate IRR (Internal Rate of Return)
- Compare a standby TCO (Total cost of Ownership) and the PV/BESS system
Setting up
First we need to continue to set up the project for this analysis.
- Project Life: 25y
- Inflation: 2%
- Energy Cost Inflation: 1.65% per year [1]
- PV O&M Costs: $2/kWdc installed
- BESS O&M Costs: 1% capital per year
- PV Degradation Rate: 1% per year
The BESS and PCS are sized for the standby power, and with this sizing it should be able to continue to meet the demand over optimal over the entire project life.
We have one more assumption that will make this a little easier:
- The load profile stays approximately the same over the project life [2]
Cash Flows and IRR Alone
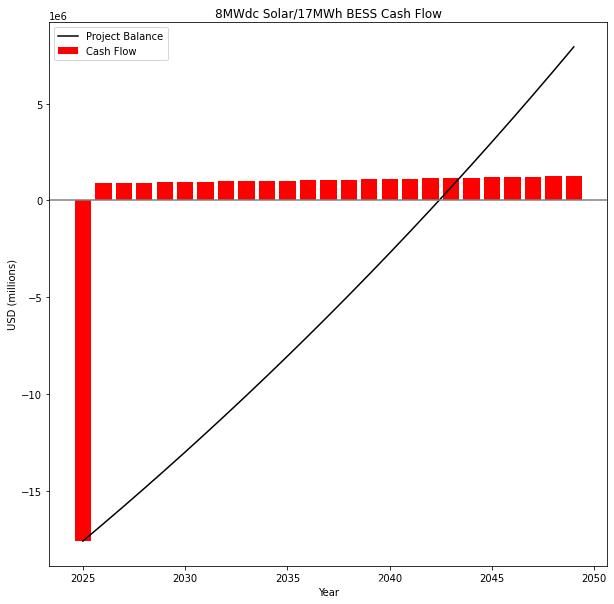
Using the assumptions and variables above, I'm able to calculate the sample load flow, and project balance for the 8000kWdc configuration.
Configuration 1 Cash Flow

With this cash flow diagram we can calculate the IRR of the project to be ~3.02% IRR.
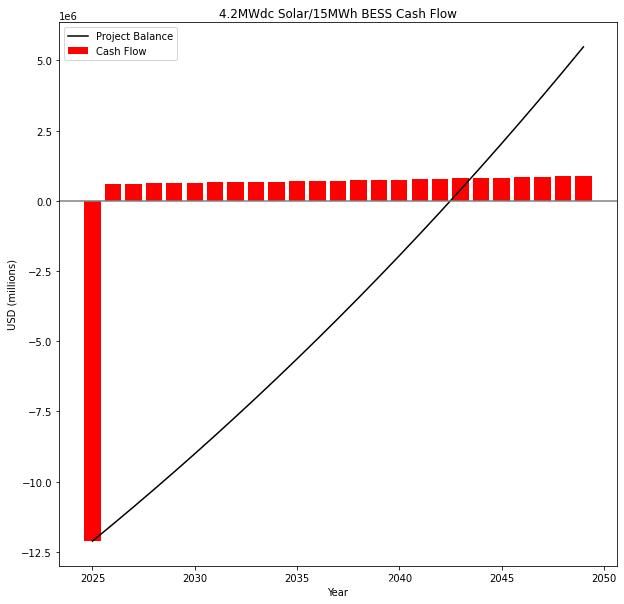
Configuration 2 Cash Flow

The smaller system doesn't fair much better at ~3.01% IRR.
Not the whole story
Luckily for us, or at this this project example, this isn't the whole story. The purpose of this system is not just to decrease utility expenses, in fact, that is a side benefit of the system, and as such the project shouldn't be evaluated on that alone. In fact, it is this standby power requirement, and the full 24h of BESS that is driving the capital cost of the project. In fact the peak optimal demand [3] is only 2.3MW, so the minimum BESS size needed to meet this requirement is likelt in the 5-8MWh range [4] not the 15MWh needed to accomodate 80% depth SOC for the standby load.
So, what is another way to look at this? Well I already mentioned it, it is the TCO of the alternative generator.
For this analysis I'm using a 1MW diesel genset, this is going to be slightly higher than that of a natural gas genset because of the need for more frequent full load testing, fuel costs and fuel cleaning/maintenance costs.
Total Cost of Ownership
I was hoping to hop online and then quickly find a couple of tables outlining the TCO for various standby gensets based on size, location, fuel type, etc. To my surprise I couldn't find a thing, and the one partly helpful PDF that I did find had a MAJOR typo [5] and the TCO tool it links to is broken. It did however give me a starting point for the analysis and assumptions.
- Tank Size: 3600L
- Load Bank Testing: Full load, 8h, every 3 years
- Diesel Fuel Maintenance: Full tank, every 2y, $1/gal
- Run Hours: 20h no-load, 40h with load per year
- Annual Maintenance: $500 for the tech to do the work and $1/kW for materials.
- Capital Cost: $500/kW [6]
Fuel Price
This is a tough one, so what I used was the USA average on November 25, 2024 for on-road, it may be $0.25 /gal cheaper for off-road fuel, but the diversity across the USA and seasonally, more than covers this difference.
The Genset Used
I'm writing this on November 29th, and it is suprisingly hard to find people to give some numbers and detailed specs for this exercise. Luckily I was able to find a generator spec sheet for a Cat C27 that had the fuel consumption rates that I needed.
With these rates I interpolated the "average" load rate that I used for the on-load serving time, and I used 1/2 of the 25% load for any unloaded standby running time. That is probably low, but I think that it will work for this example.
TCO Results
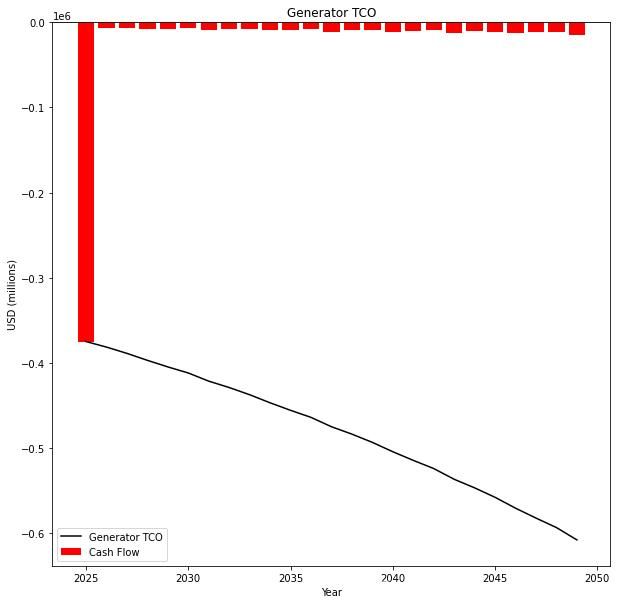
For this example I end up with a TCO of $610k for the standby generator option.

To tell you the truth, this was a lot less that I was expecting, and I think, that there are some maintenance costs that I don't have in here correctly yet, but it does line up closely with one of the only examples of TCO that I found.
Comparing with PV BESS Options
While that graph looks damning, it start way down and only keeps going down, when you compare it to the project balances for the two solar options above, it is basically a straight line.

Financial Conclusion
I'm an engineer, not an MBA, but based on just these metrics, I think its inconclusive. The IRR of the PV/BESS option will not justify the project on its own, the average cost of capital in 2024 was 7%, the 3% we calculated doesn't come close.
The TCO for a comparable standby diesel generator doesn't help move the needle toward PV/BESS, at least for this example.
Over the holidays I will try a similar analysis with different electricity costs, local irridiation, and diesel fuel prices to see if the challenge here is the relatively cheap power and diesel fuel, or if the cost of batteries are still too high to allow for a project like this to stand on its own.
I'm not done yet.
Footnotes
| [1] | I'm assuming that this is constant. We used the number published here |
| [2] | For an established industrial/manufacturing site this is going to be accurate, and when there are changes to the process that will affect the load of the system, these changes will have their own economic analysis that would take into account the new load profile established by the PV/BESS system. |
| [3] | Optimal peak was defined in the first post of this series. It is the hourly peak over the average for that day. The BESS would ensure that the daily load would stay at or below the calculated optimum. The PV generation does a decent job following the load profile, but the typical peak is slightly later in the afternoon, when the PV drops because of both heat and sun angle. |
| [4] | Because the minimum BESS required for the standby was so much larger than that needed for the demand shifting I didn't calculate the actual energy needed for this purpose. That may be an anlysis for another post. |
| [5] | The PDF is comparing the TCO of diesel to natural gas, trying to sell the natural gas option as having a lower TCO, however they suggest that the TCO is the same $110,000 for a 150kW unit and a 2MW unit. I'm pretty sure its a copy/paste error, but in any case its not useful for this. |
| [6] | This is assuming about $100/kW for installation and $400/kW for the genset, complete with a full tank of fuel. |
| [7] | The COst of capital value is from this page compiled by Aswath Damodaran |
